
Visualize on-page trends at scale to understand how visitors are engaging with your websites and apps using Medallia’s heatmaps.
DIGITAL EXPERIENCE ANALYTICS
Heatmaps
Get at-a-glance insight into aggregate trends
See where visitors are focusing
Immediately understand where engagement is highest
Focus on what you need to know
Whether it’s clicks, conversions, behaviors, or focus time
Make data-driven decisions
Compare heatmaps side-by-side for smarter A/B testing

Adjust for your audience
Uncover what customers want, and give it to them
Visualize customer behavior, realize faster ROI
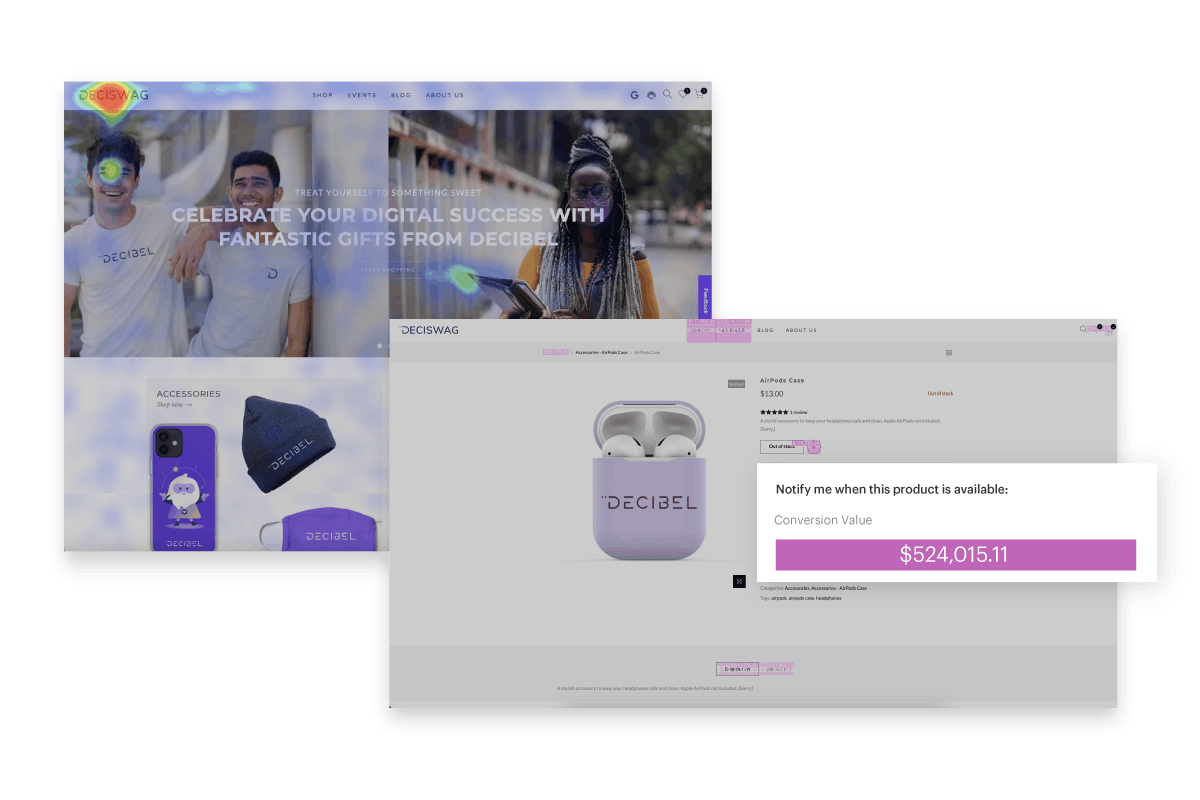
Understand everything that happens on your digital properties. Medallia tracks traditional heatmap metrics such as clicks, hovers, conversion, and revenue, while also surfacing deeper insights, such as the sentiment of your users as they interact with on-page content.
Access session replays directly from heatmaps in a single click. This seamless workflow makes it easy to quickly understand and resolve emerging trends.
Get insight into every type of interaction
Access a comprehensive suite of heatmaps to track every on-page interaction, including:
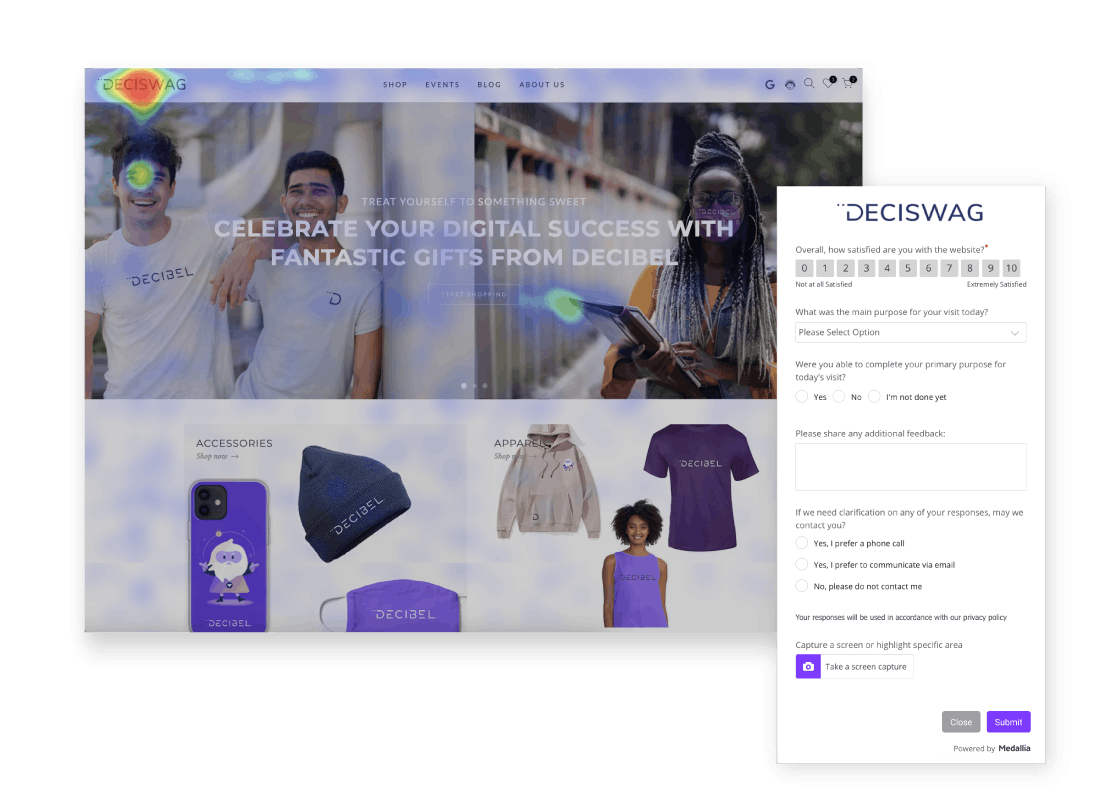
- Behavioral - track sentiment across on-page elements
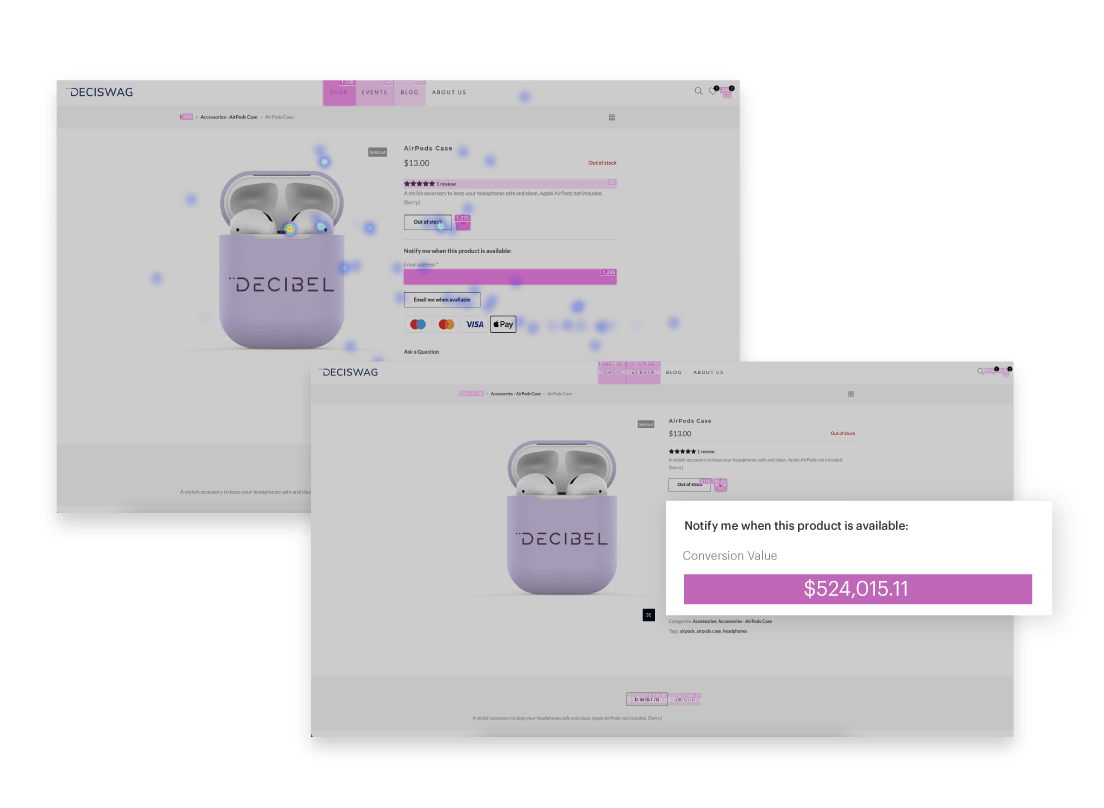
- Scroll & Dot - visualize on-page clicks and scroll activity
- Attribution - identify content that drives conversion and revenue
- Hybrid/Attention - discover what elements draw customer focus
Know your audience, optimize performance
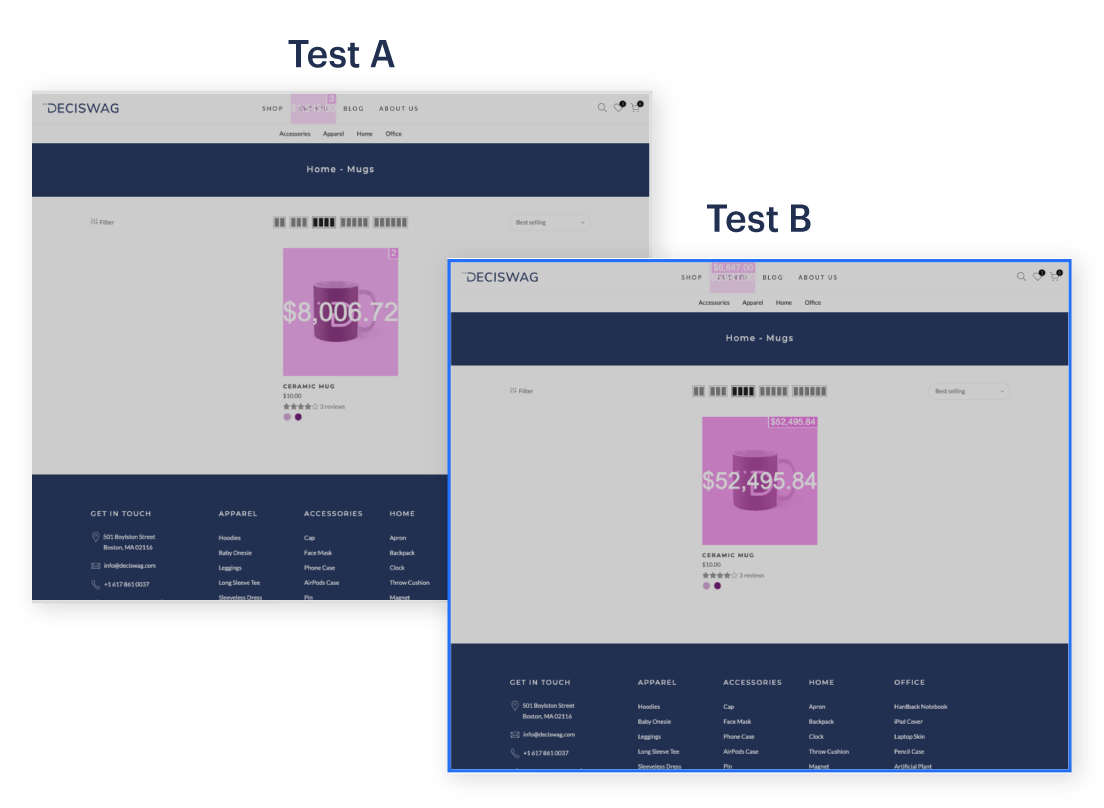
Give your customers exactly what they want. View different audience segments or types of heatmaps side-by-side to analyze A/B tests and optimize high-impact pages and screens.
Use these insights to optimize key steps in your visitor’s journey, such as campaign landing pages, package offerings, self-help pages, and checkout pages.
Case Study
How Amadeus Increased Clicks by 100% with Medallia
Learn how Amadeus increased conversion and engagement rates by +100% through data-informed layout changes with Medallia.
See Medallia for Digital in Action


Experience 101
Platform
Company
Resources
Copyright © 2024. Medallia Inc. All rights reserved.
© Medallia®, the Medallia logo, and the names and marks
associated with Medallia’s products are trademarks of Medallia and/or
its affiliates. Net Promoter, Net Promoter Score and NPS are
registered trademarks of Bain & Company, Inc., Fred Reichheld and
Satmetrix Systems, Inc. All other trademarks are the property of their
respective owners.